Solar Radiation Contour Mapping
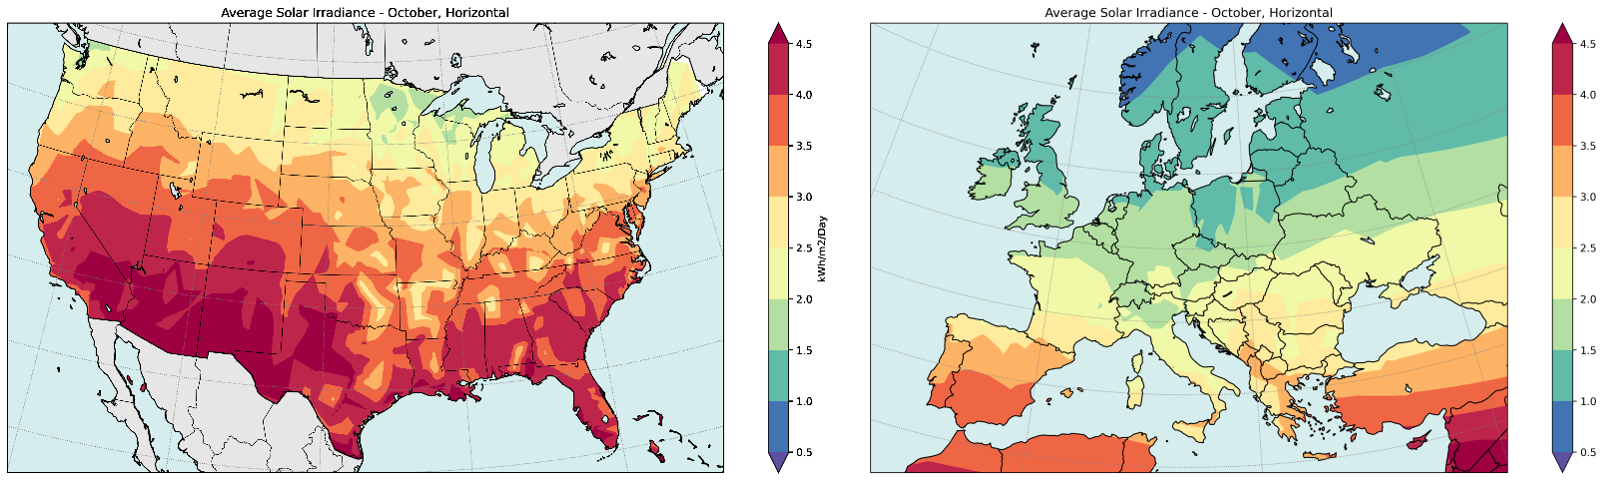
Horizontal Irradiance in October
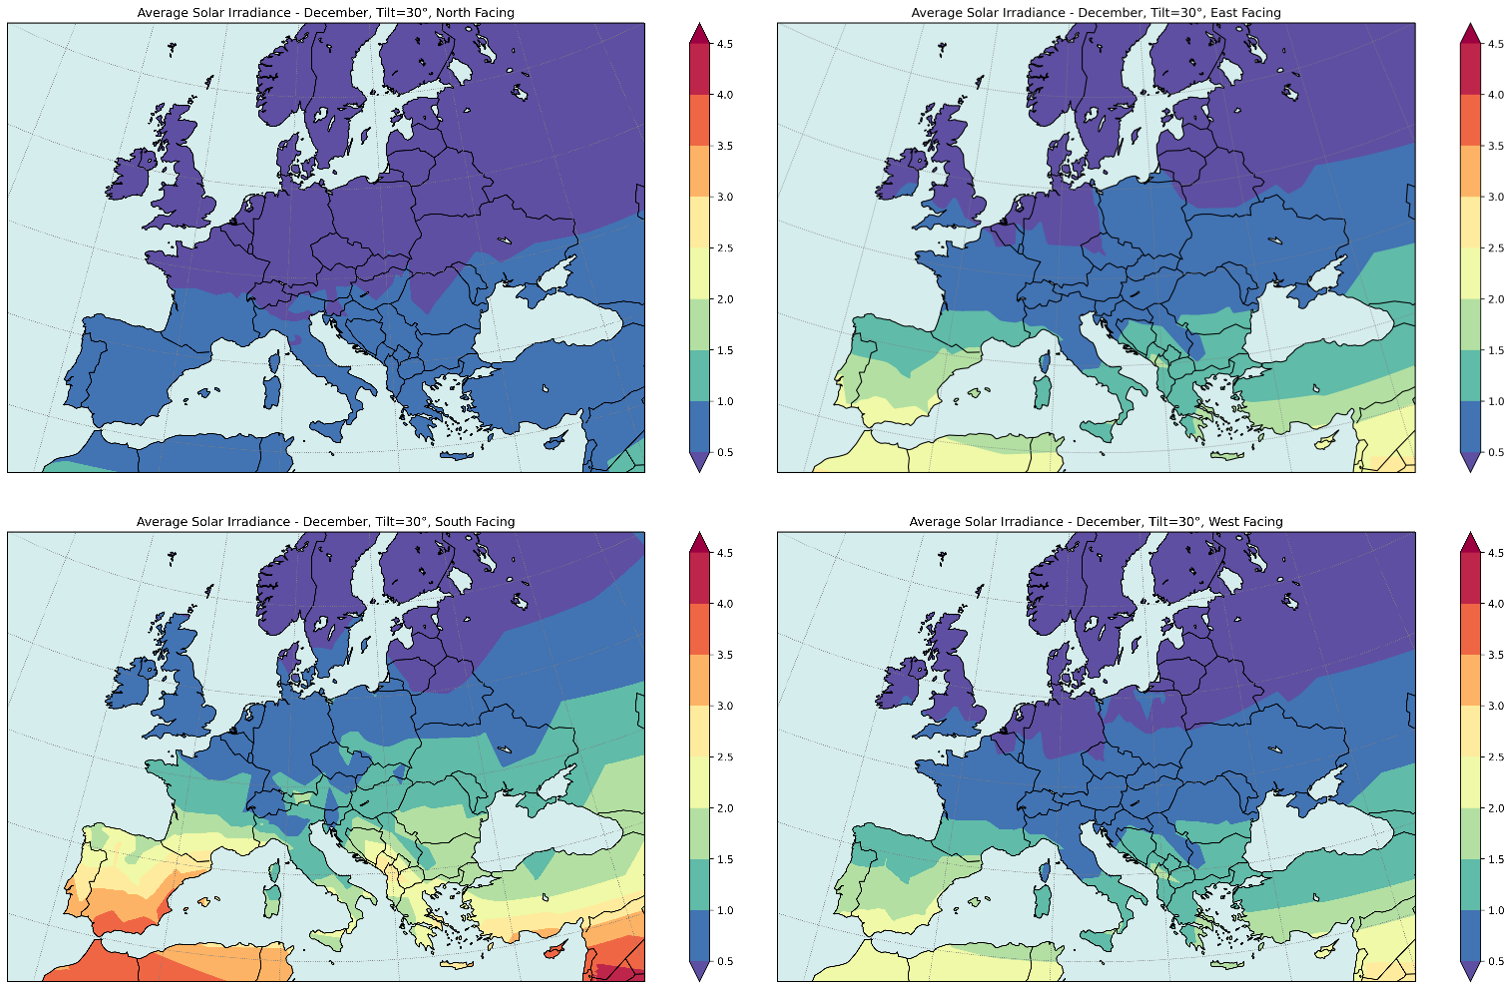
30° Tilt in December
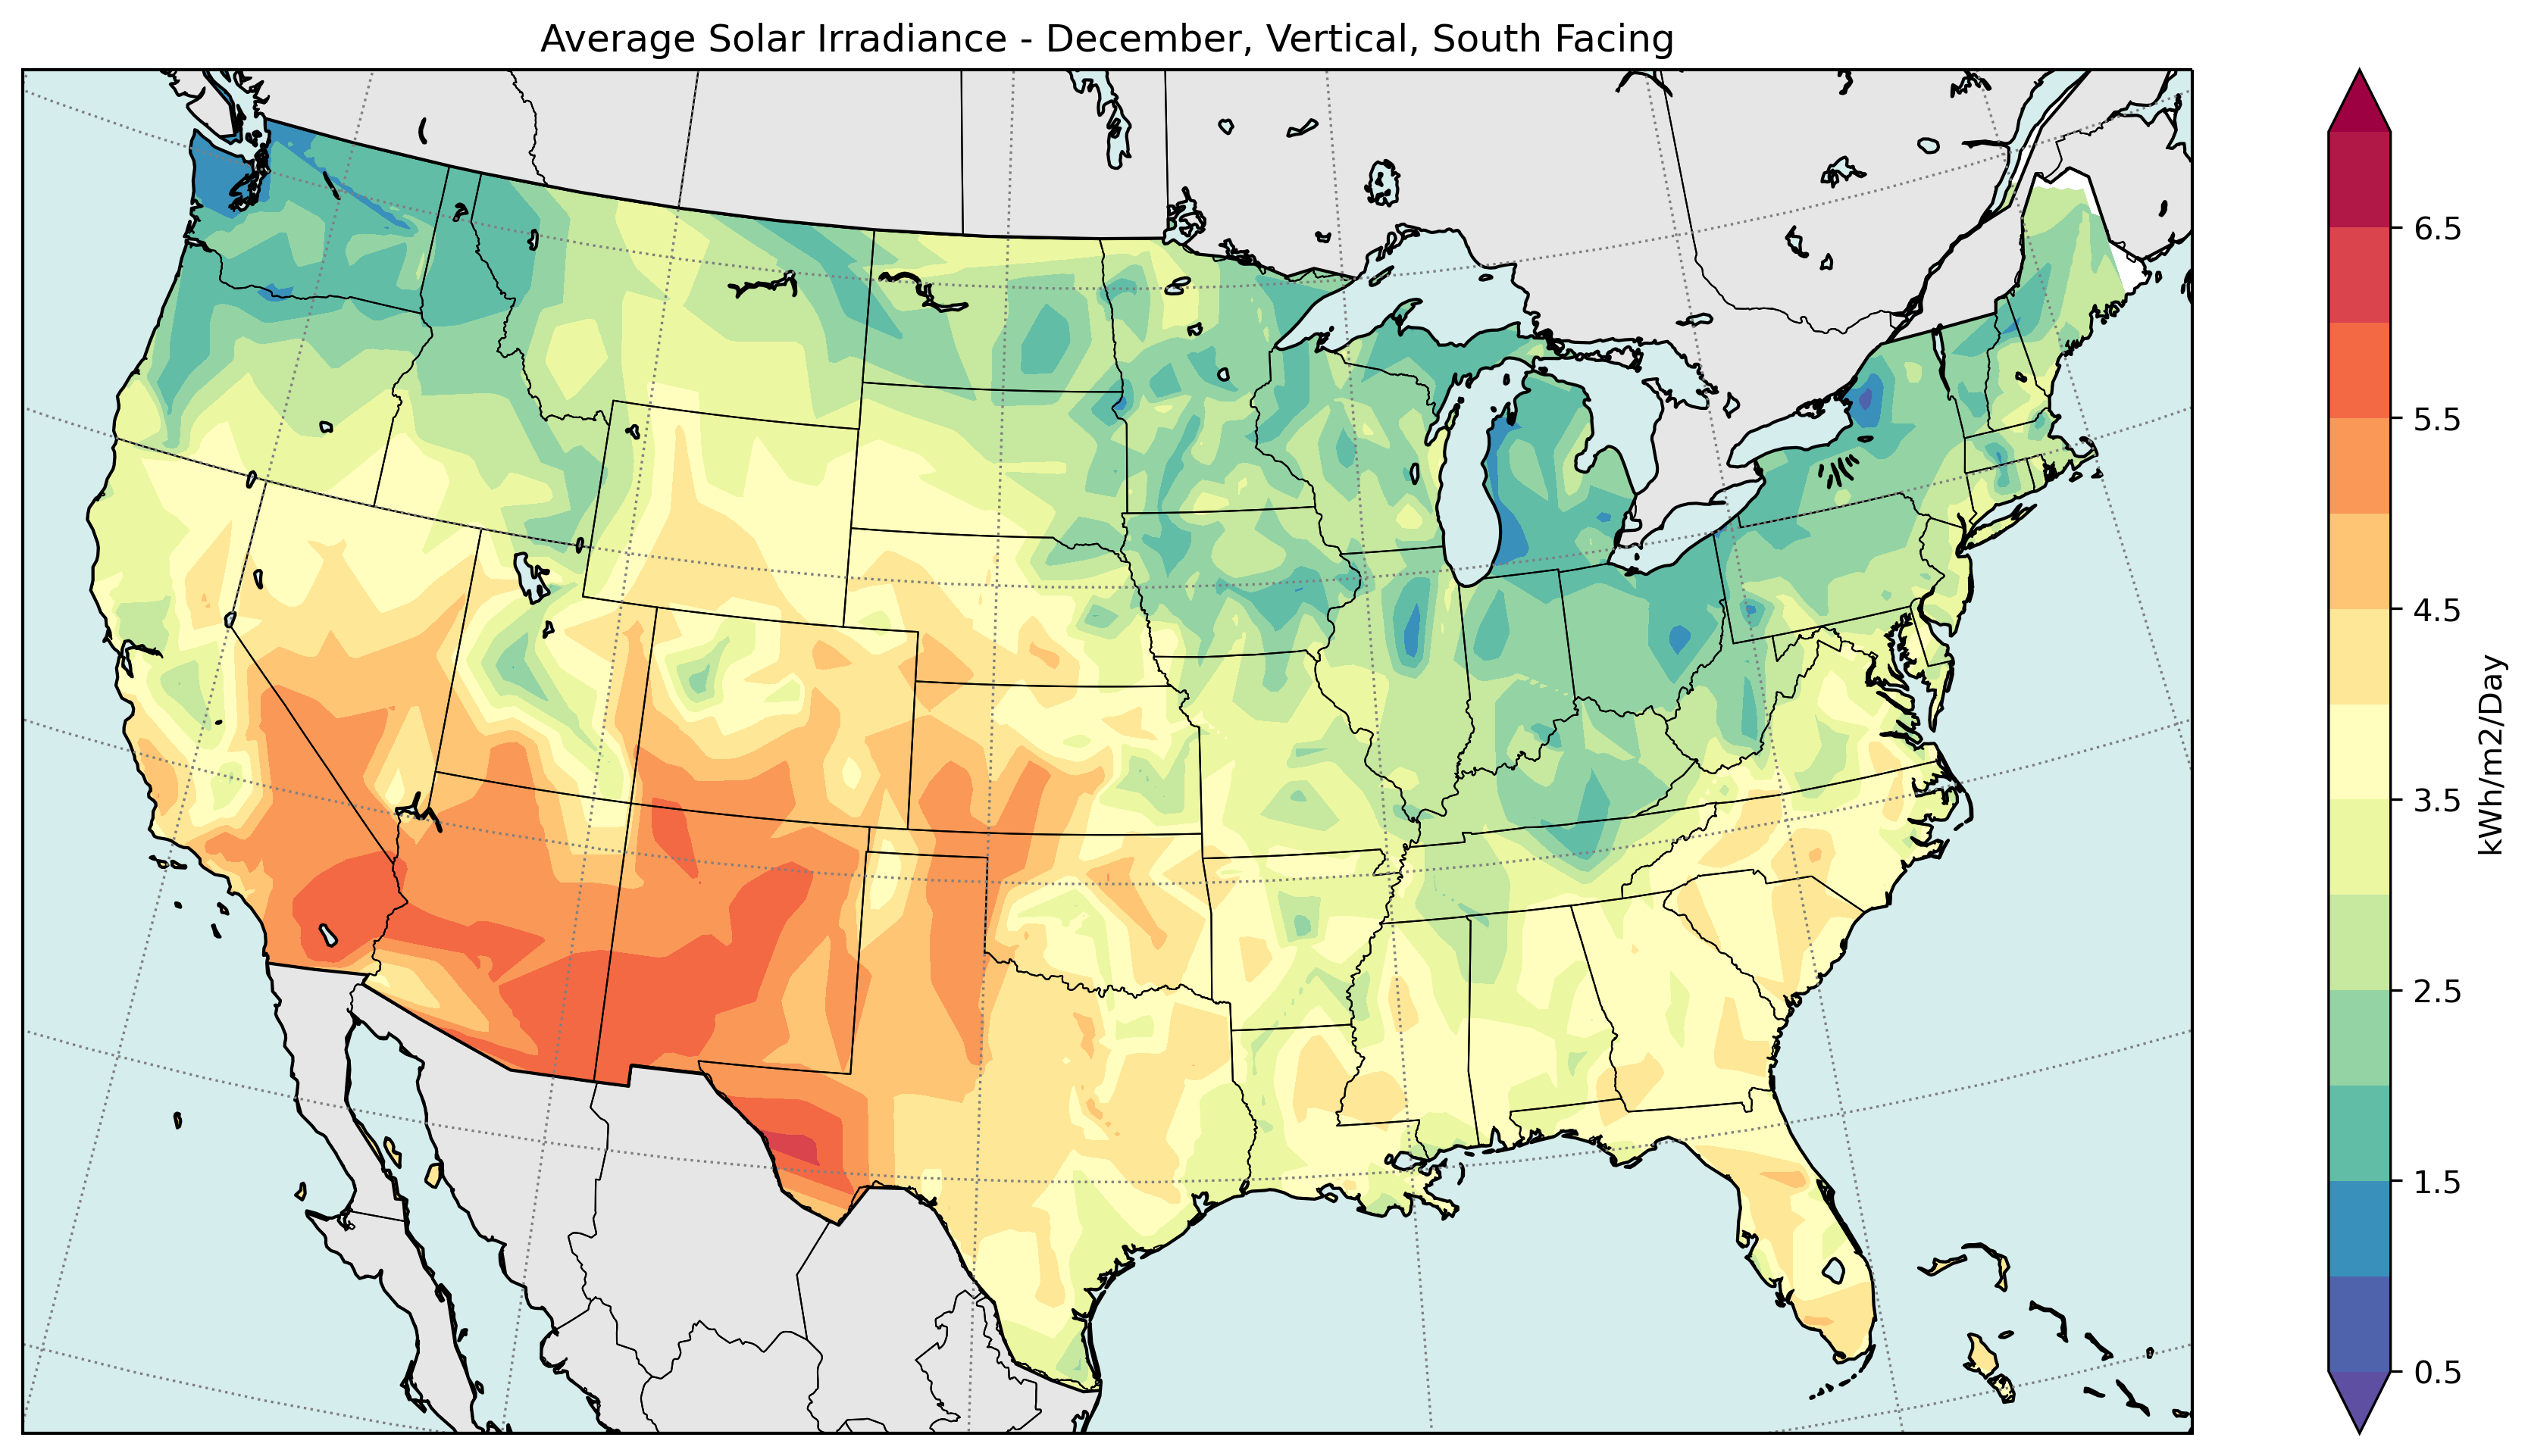
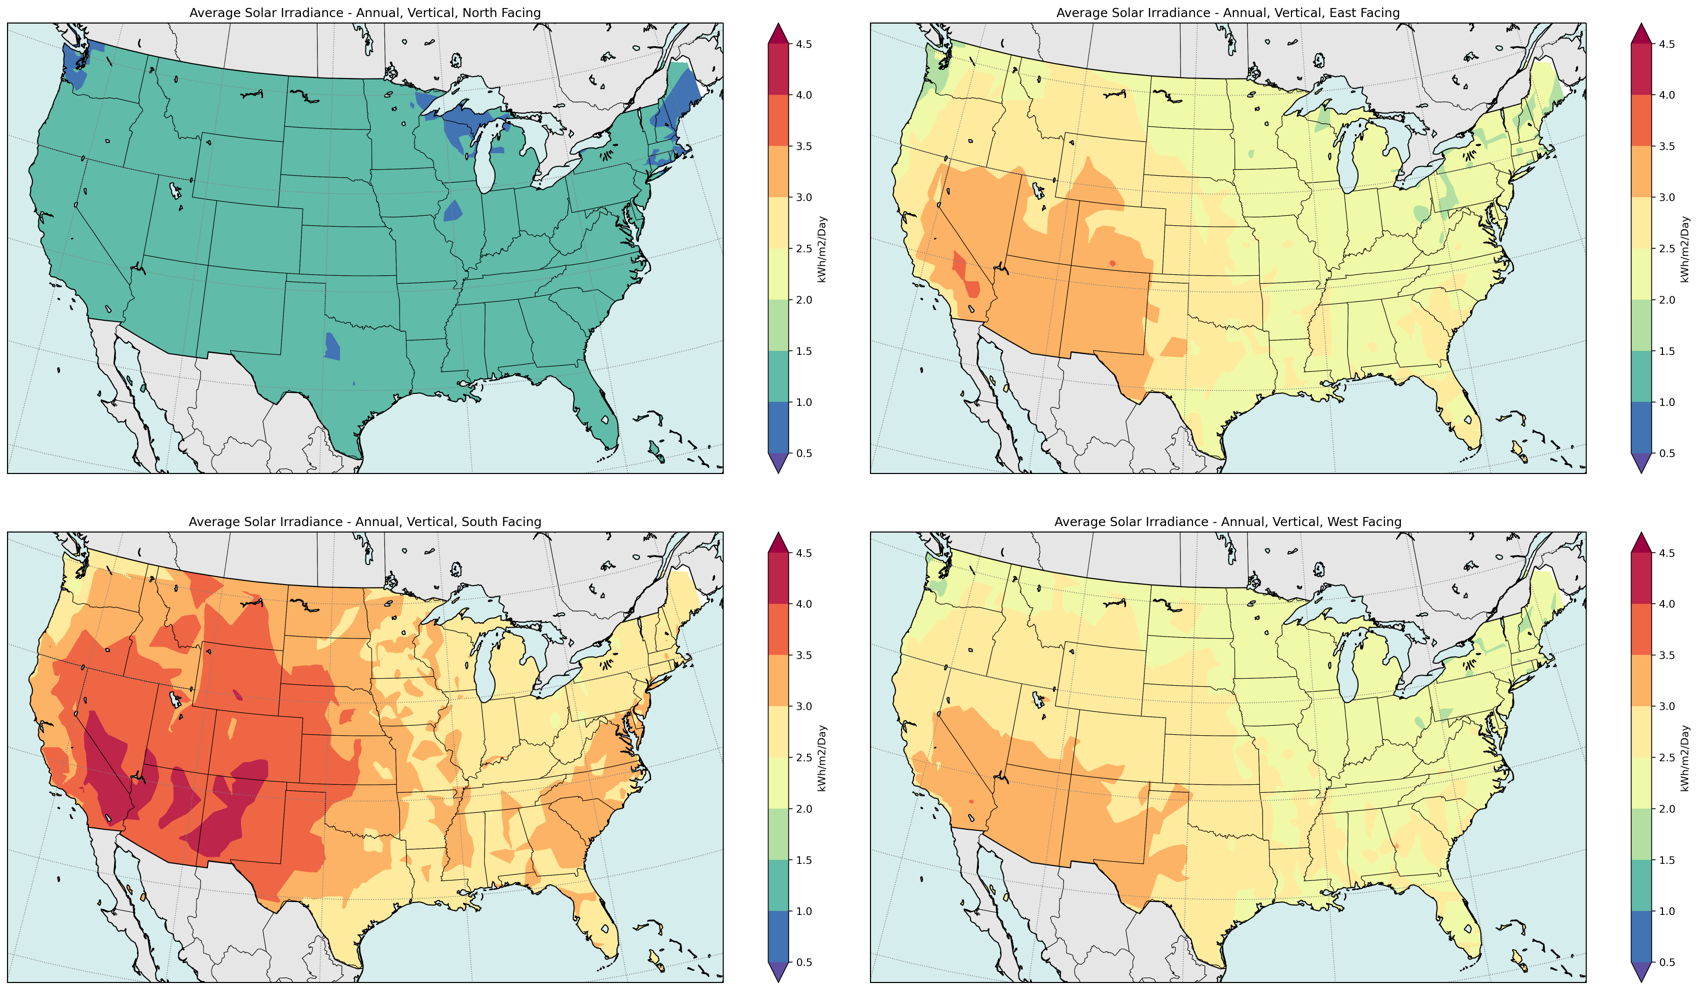
90° Tilt (Vertical) Annual Average Irradiance

About the project
Contour mapping of geographic solar radiation data (sourced from NREL) at different locations, angles, and orientations.
Built with:
Python
Project details:
The National Renewable Energy Lab (NREL) website has an app called PVWatts that allows you to enter an address anywhere in the world and enter data about a solar installation and it will return solar radiation and power output information.
I was interested in gathering just the solar radiation data at a variety of different angles and directional facings (e.g. N, E, S, W). For example, for solar windows, the solar panels would be tilt oriented vertically (90° angle), or perhaps 30° for a skylight.
I used NREL's built-in API to pull data from locations around the world and create my own solar radiation database that I then used to create contour maps at different configurations.
A more detailed description of the code can be found on the GitHub README document.